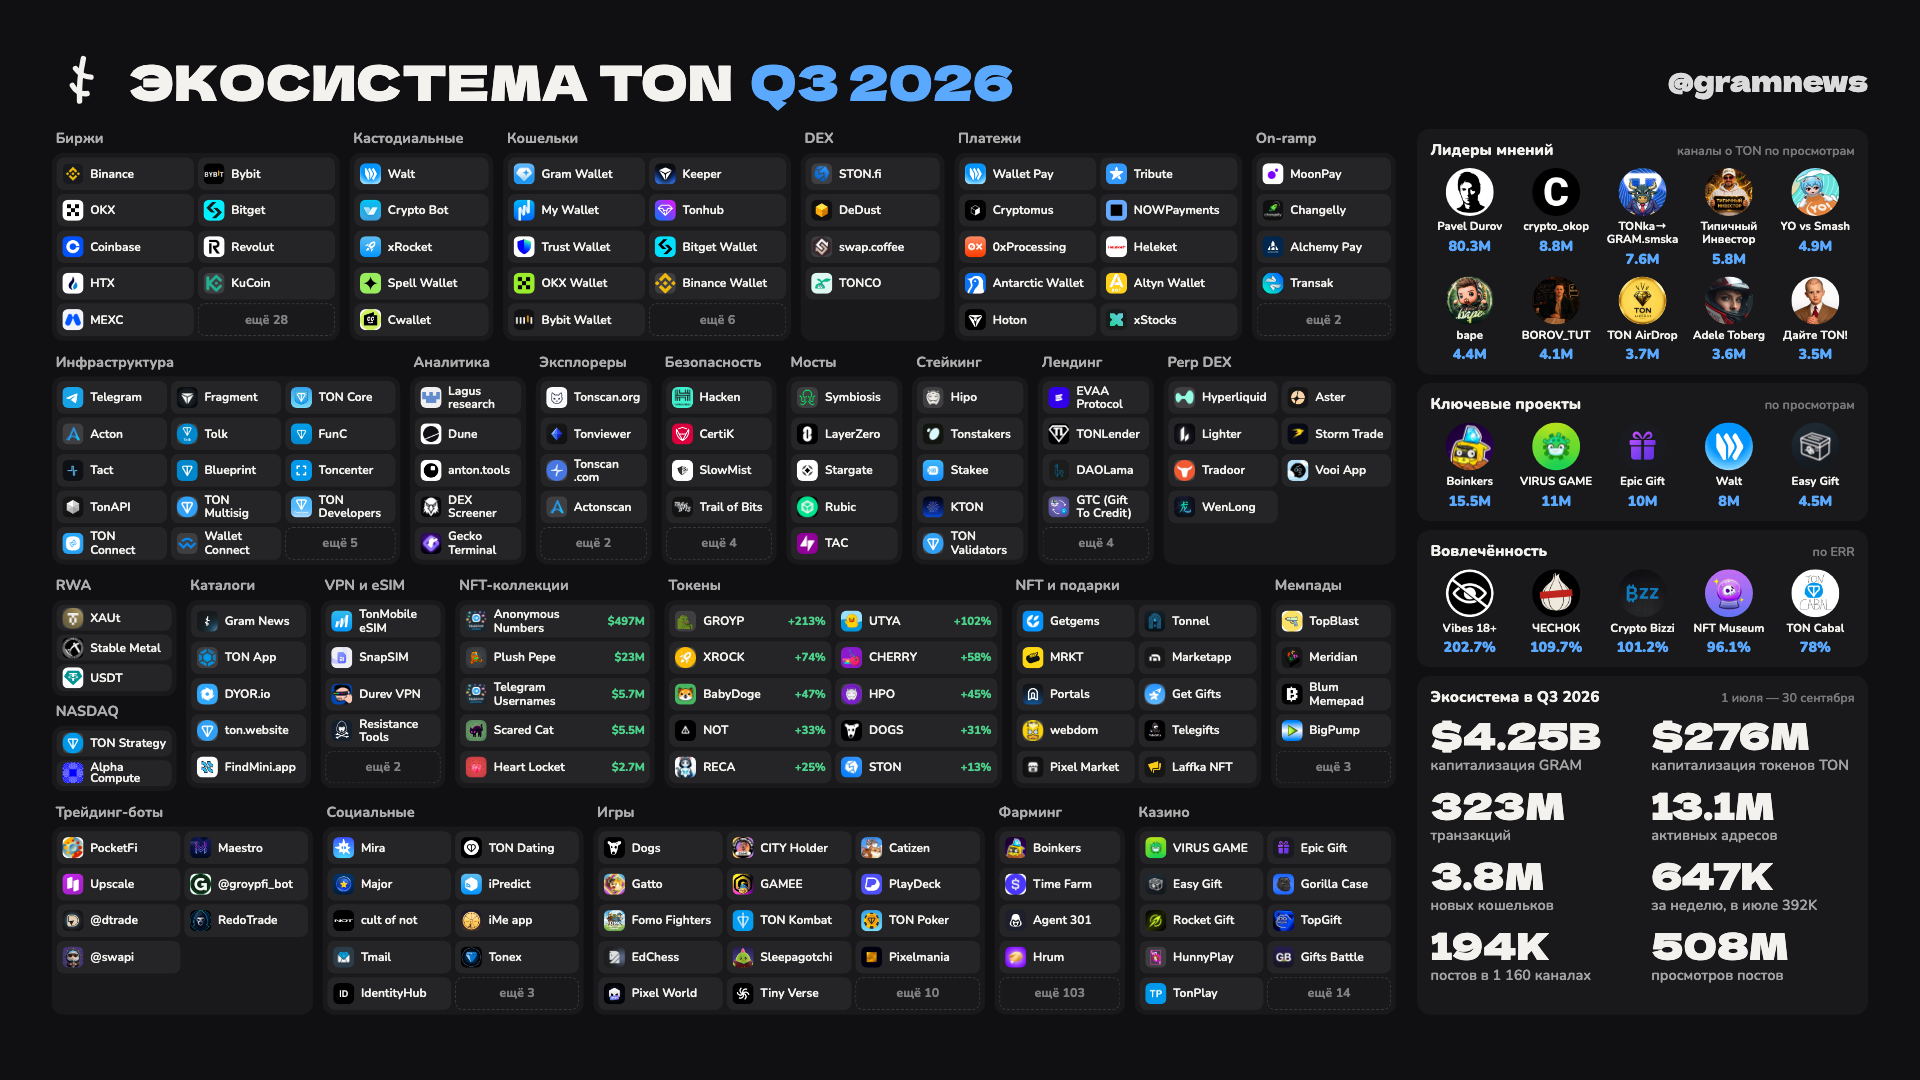
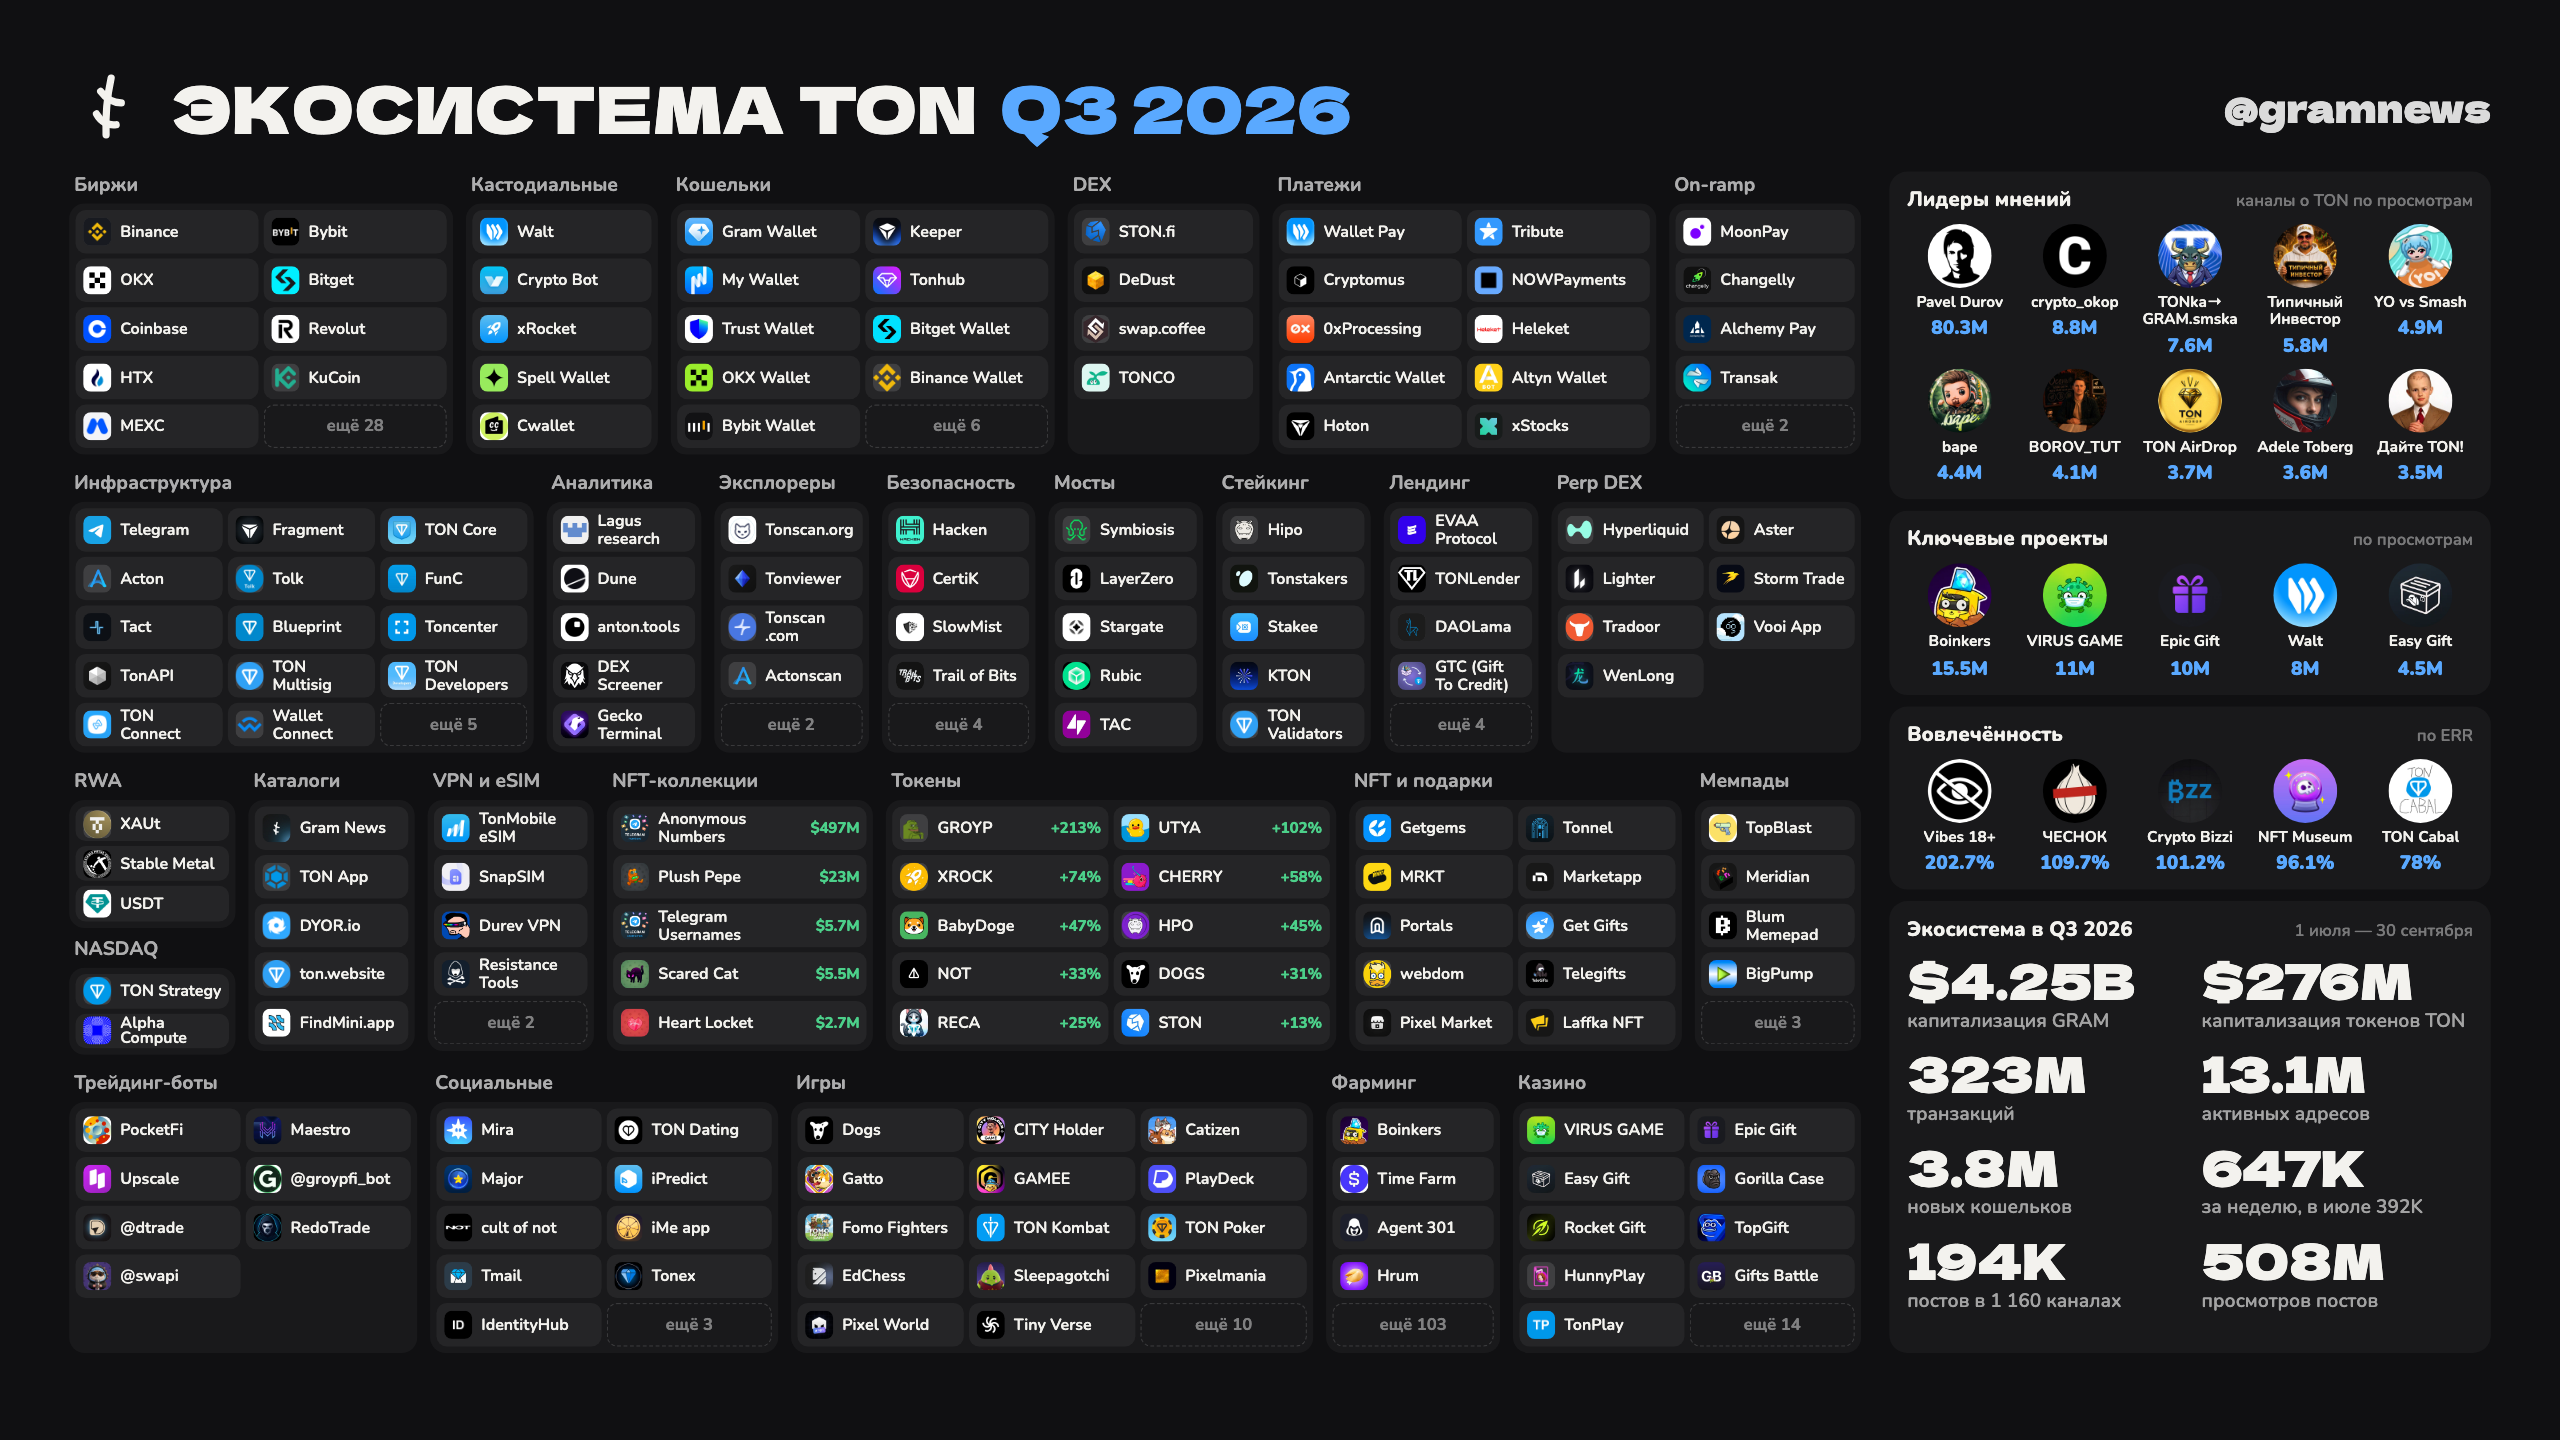
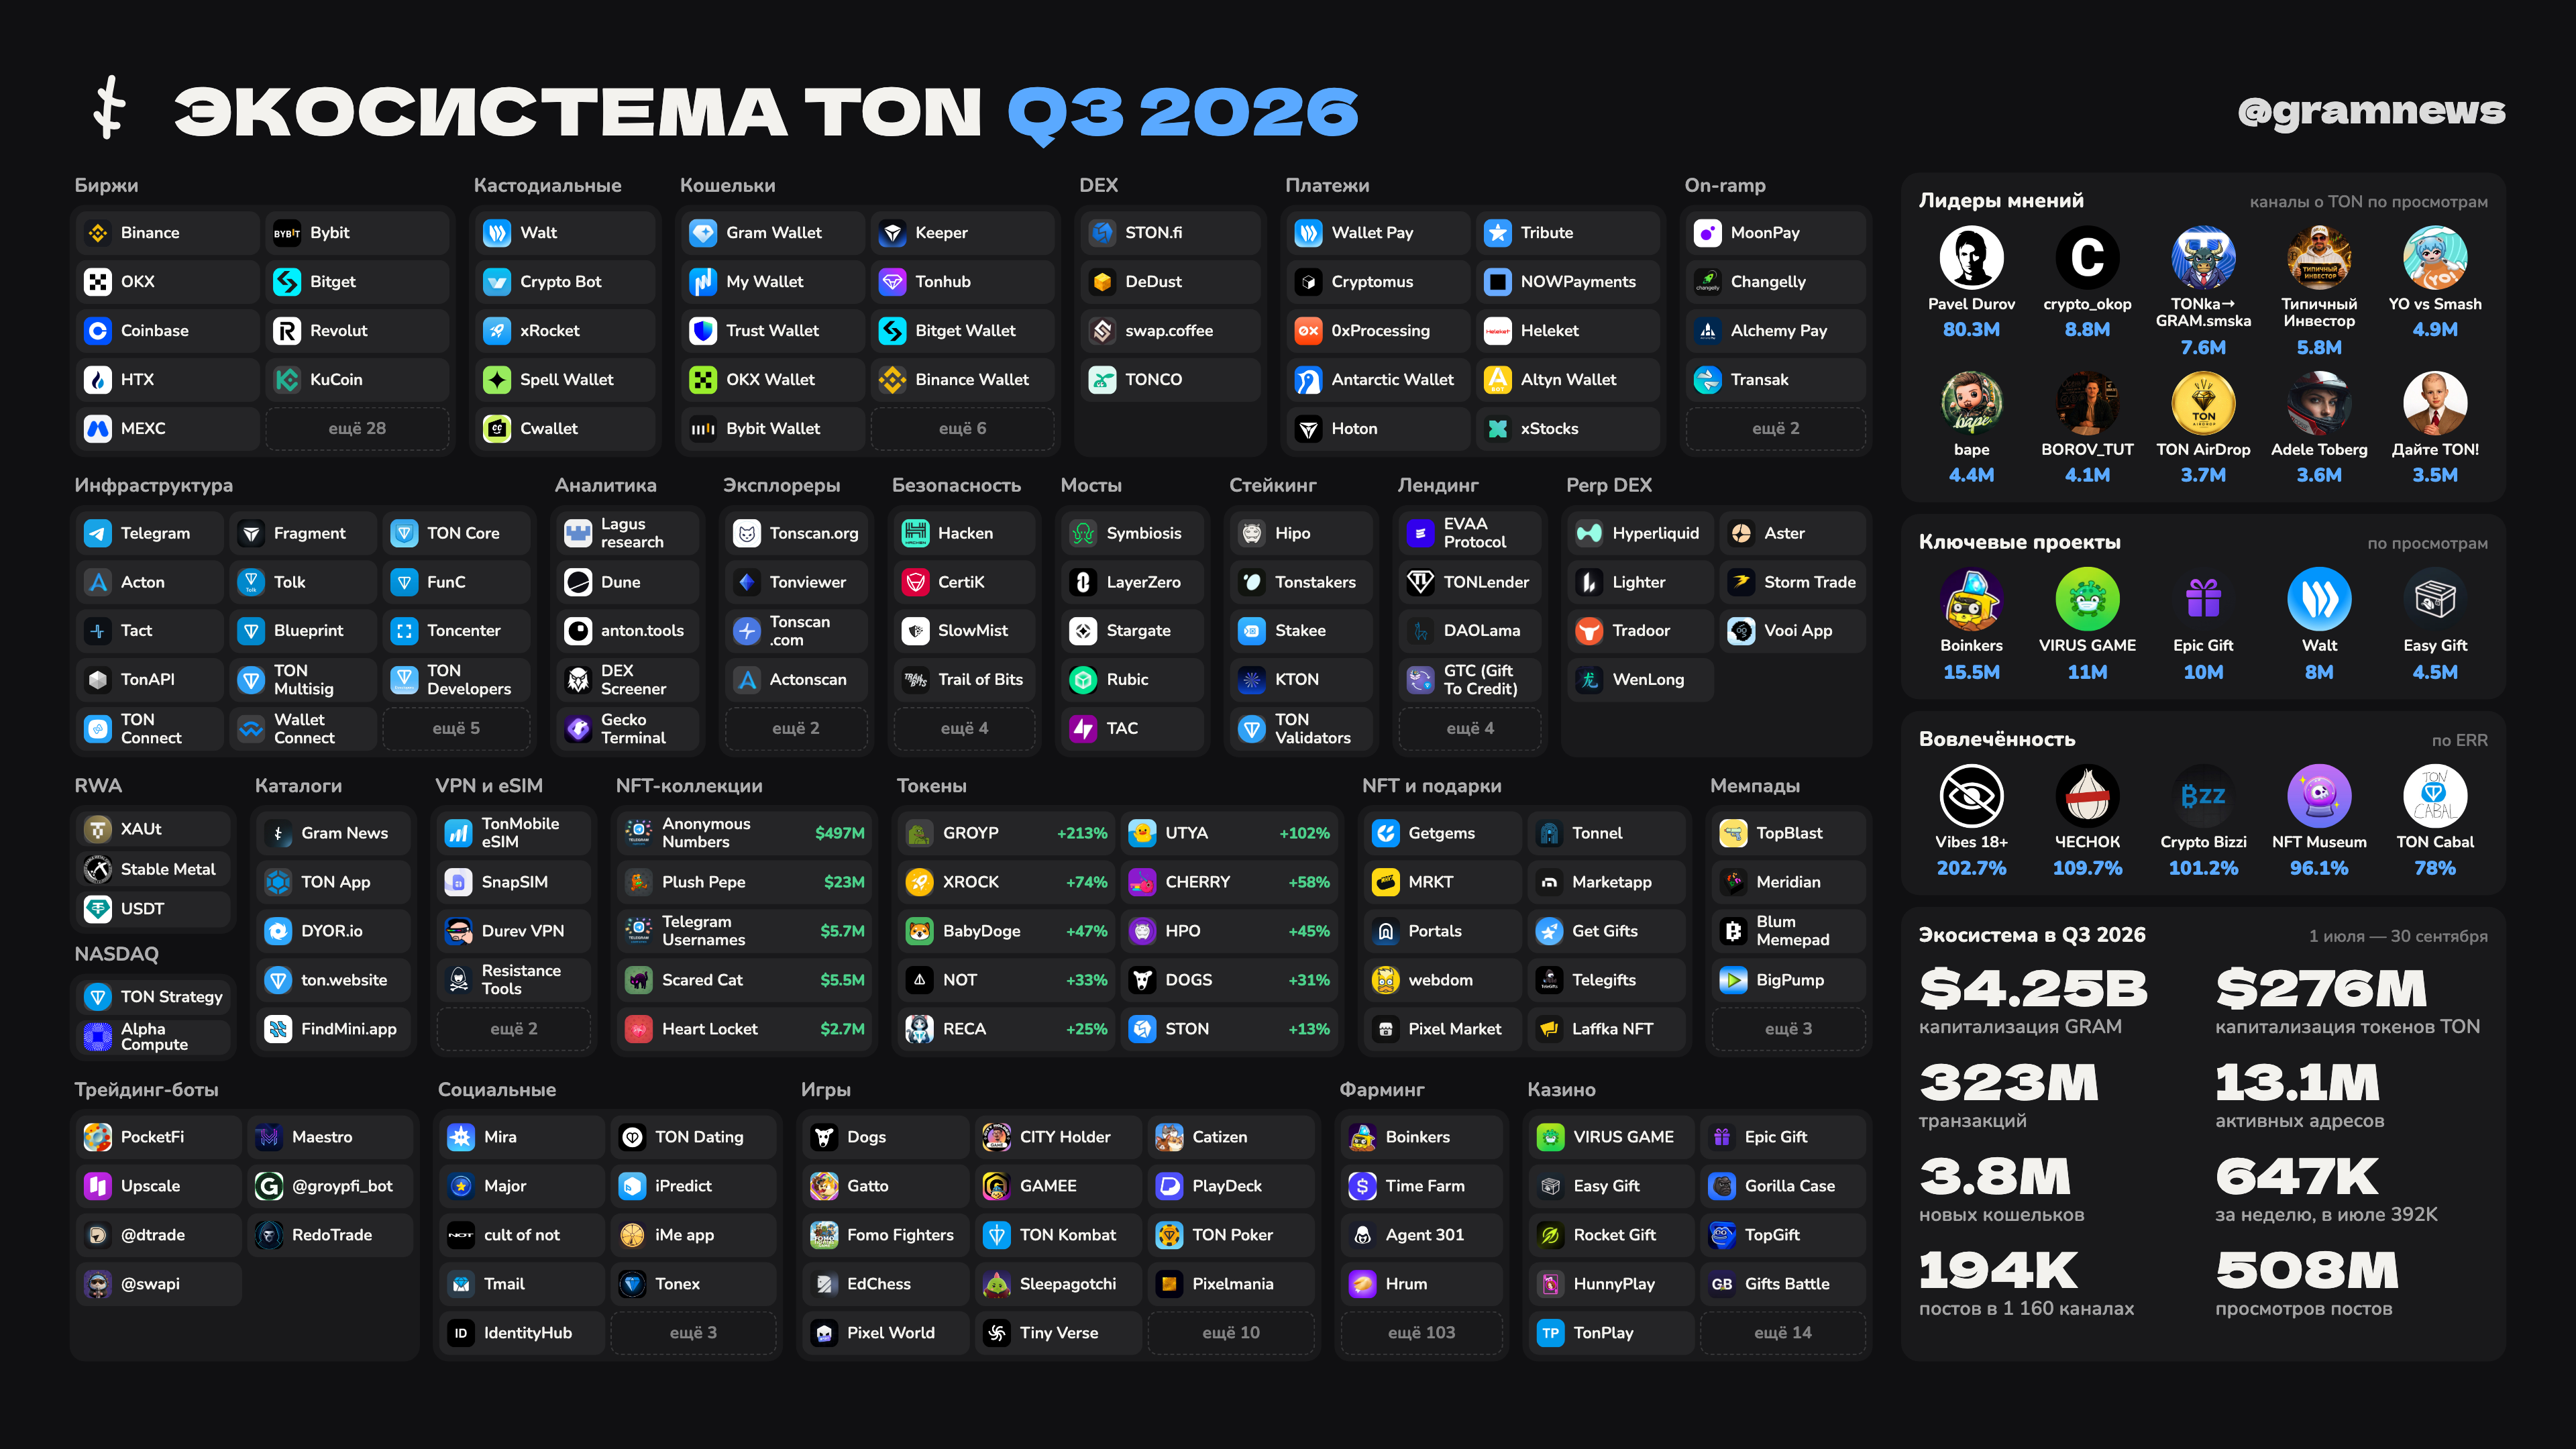
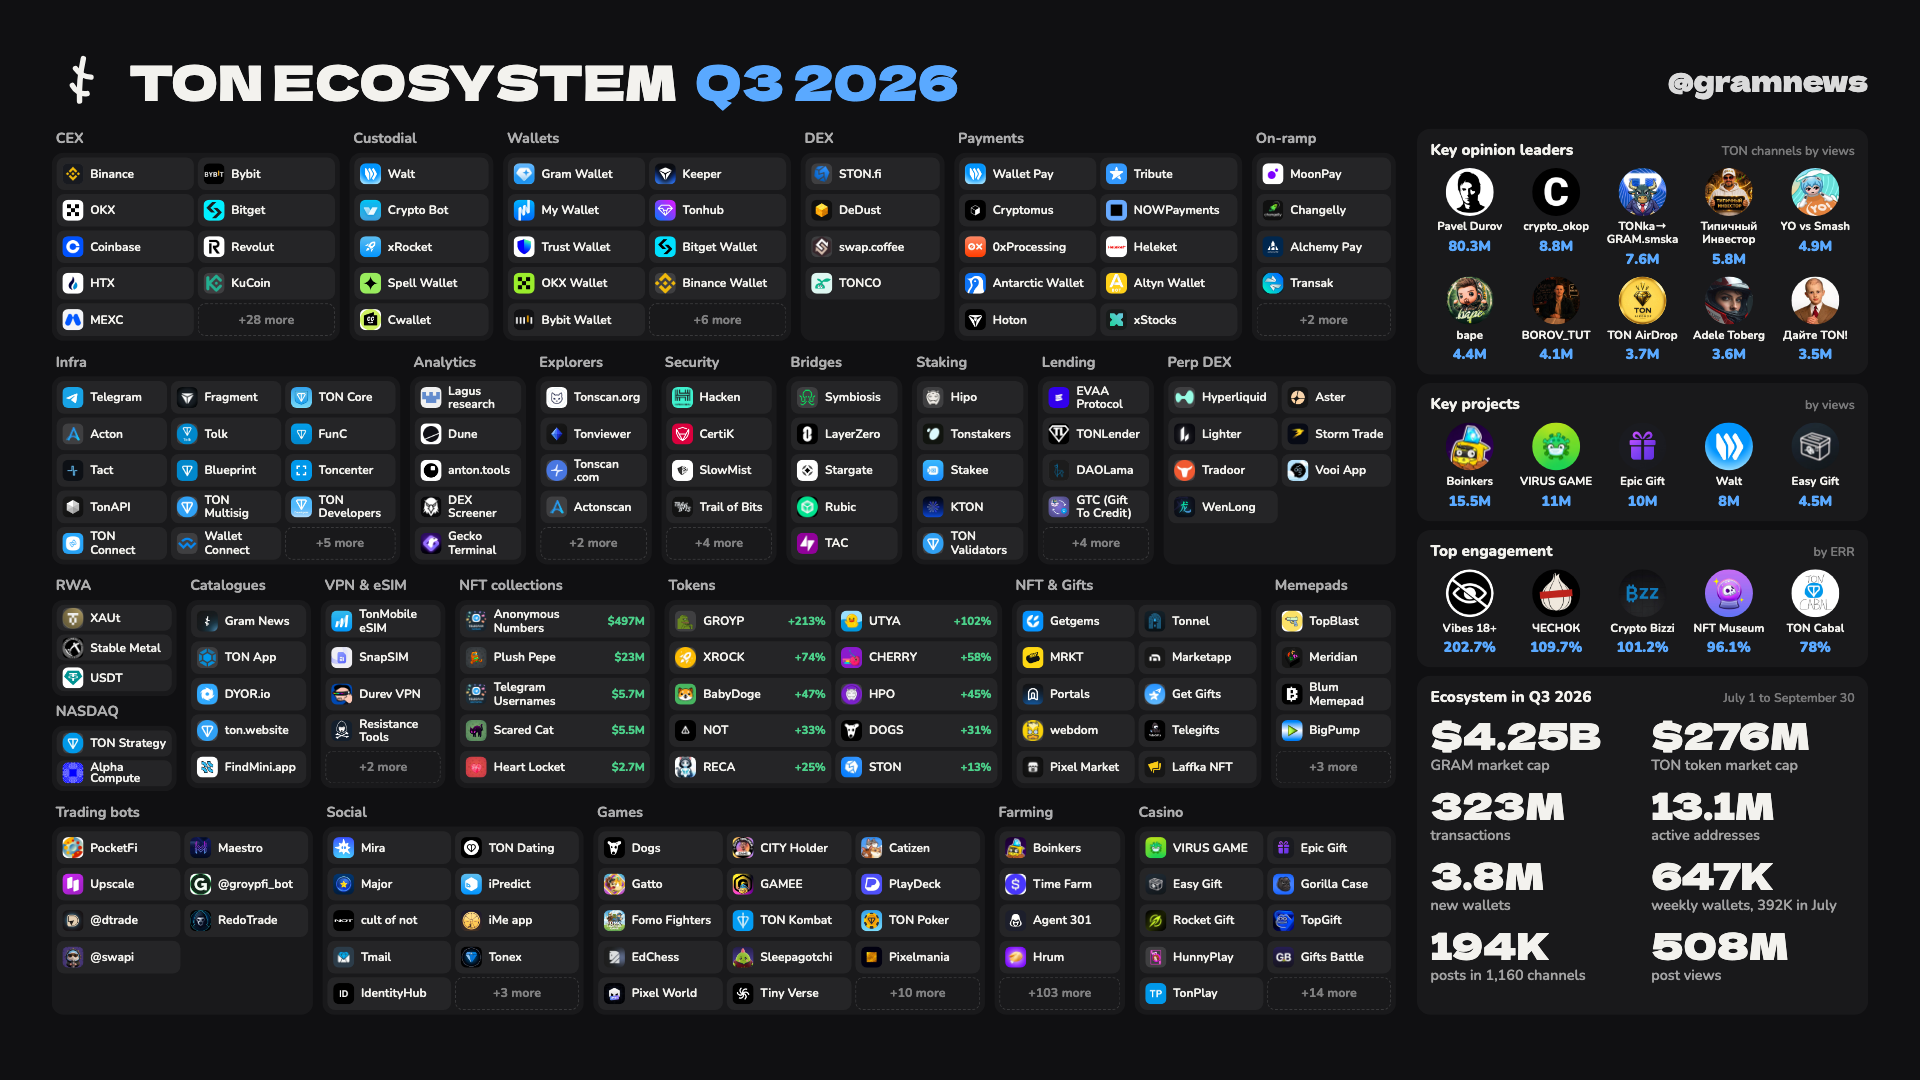
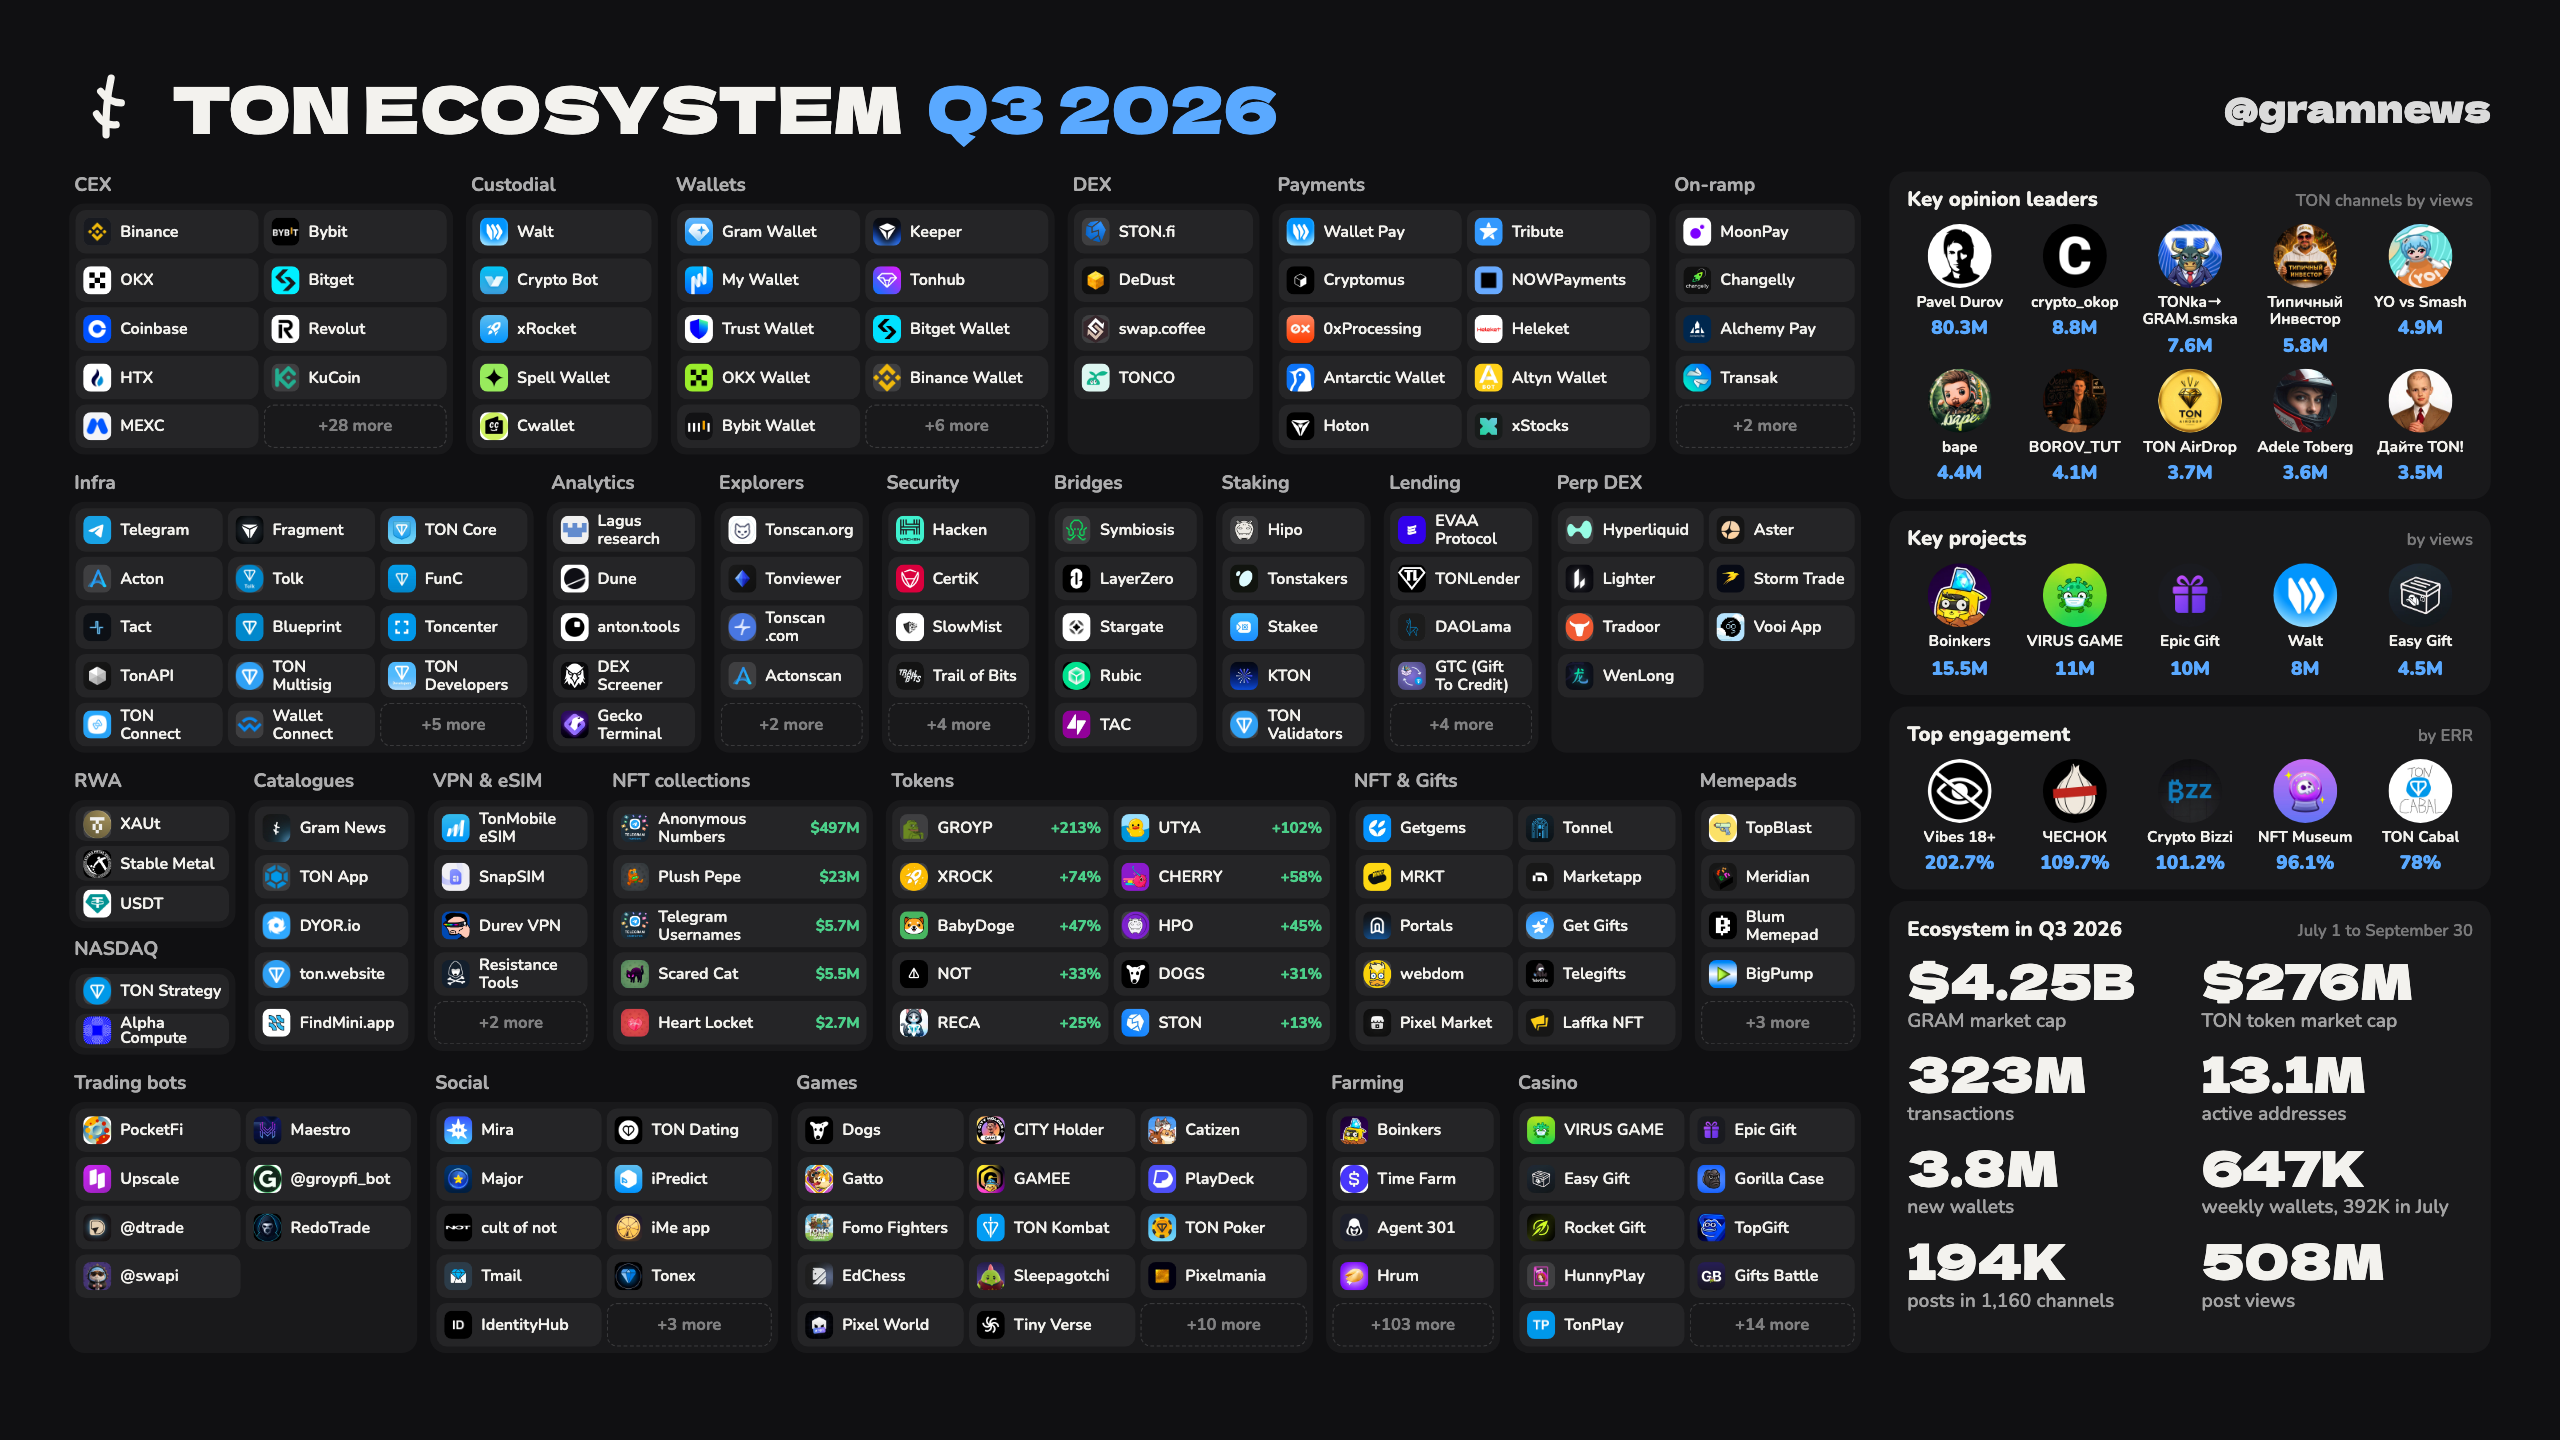
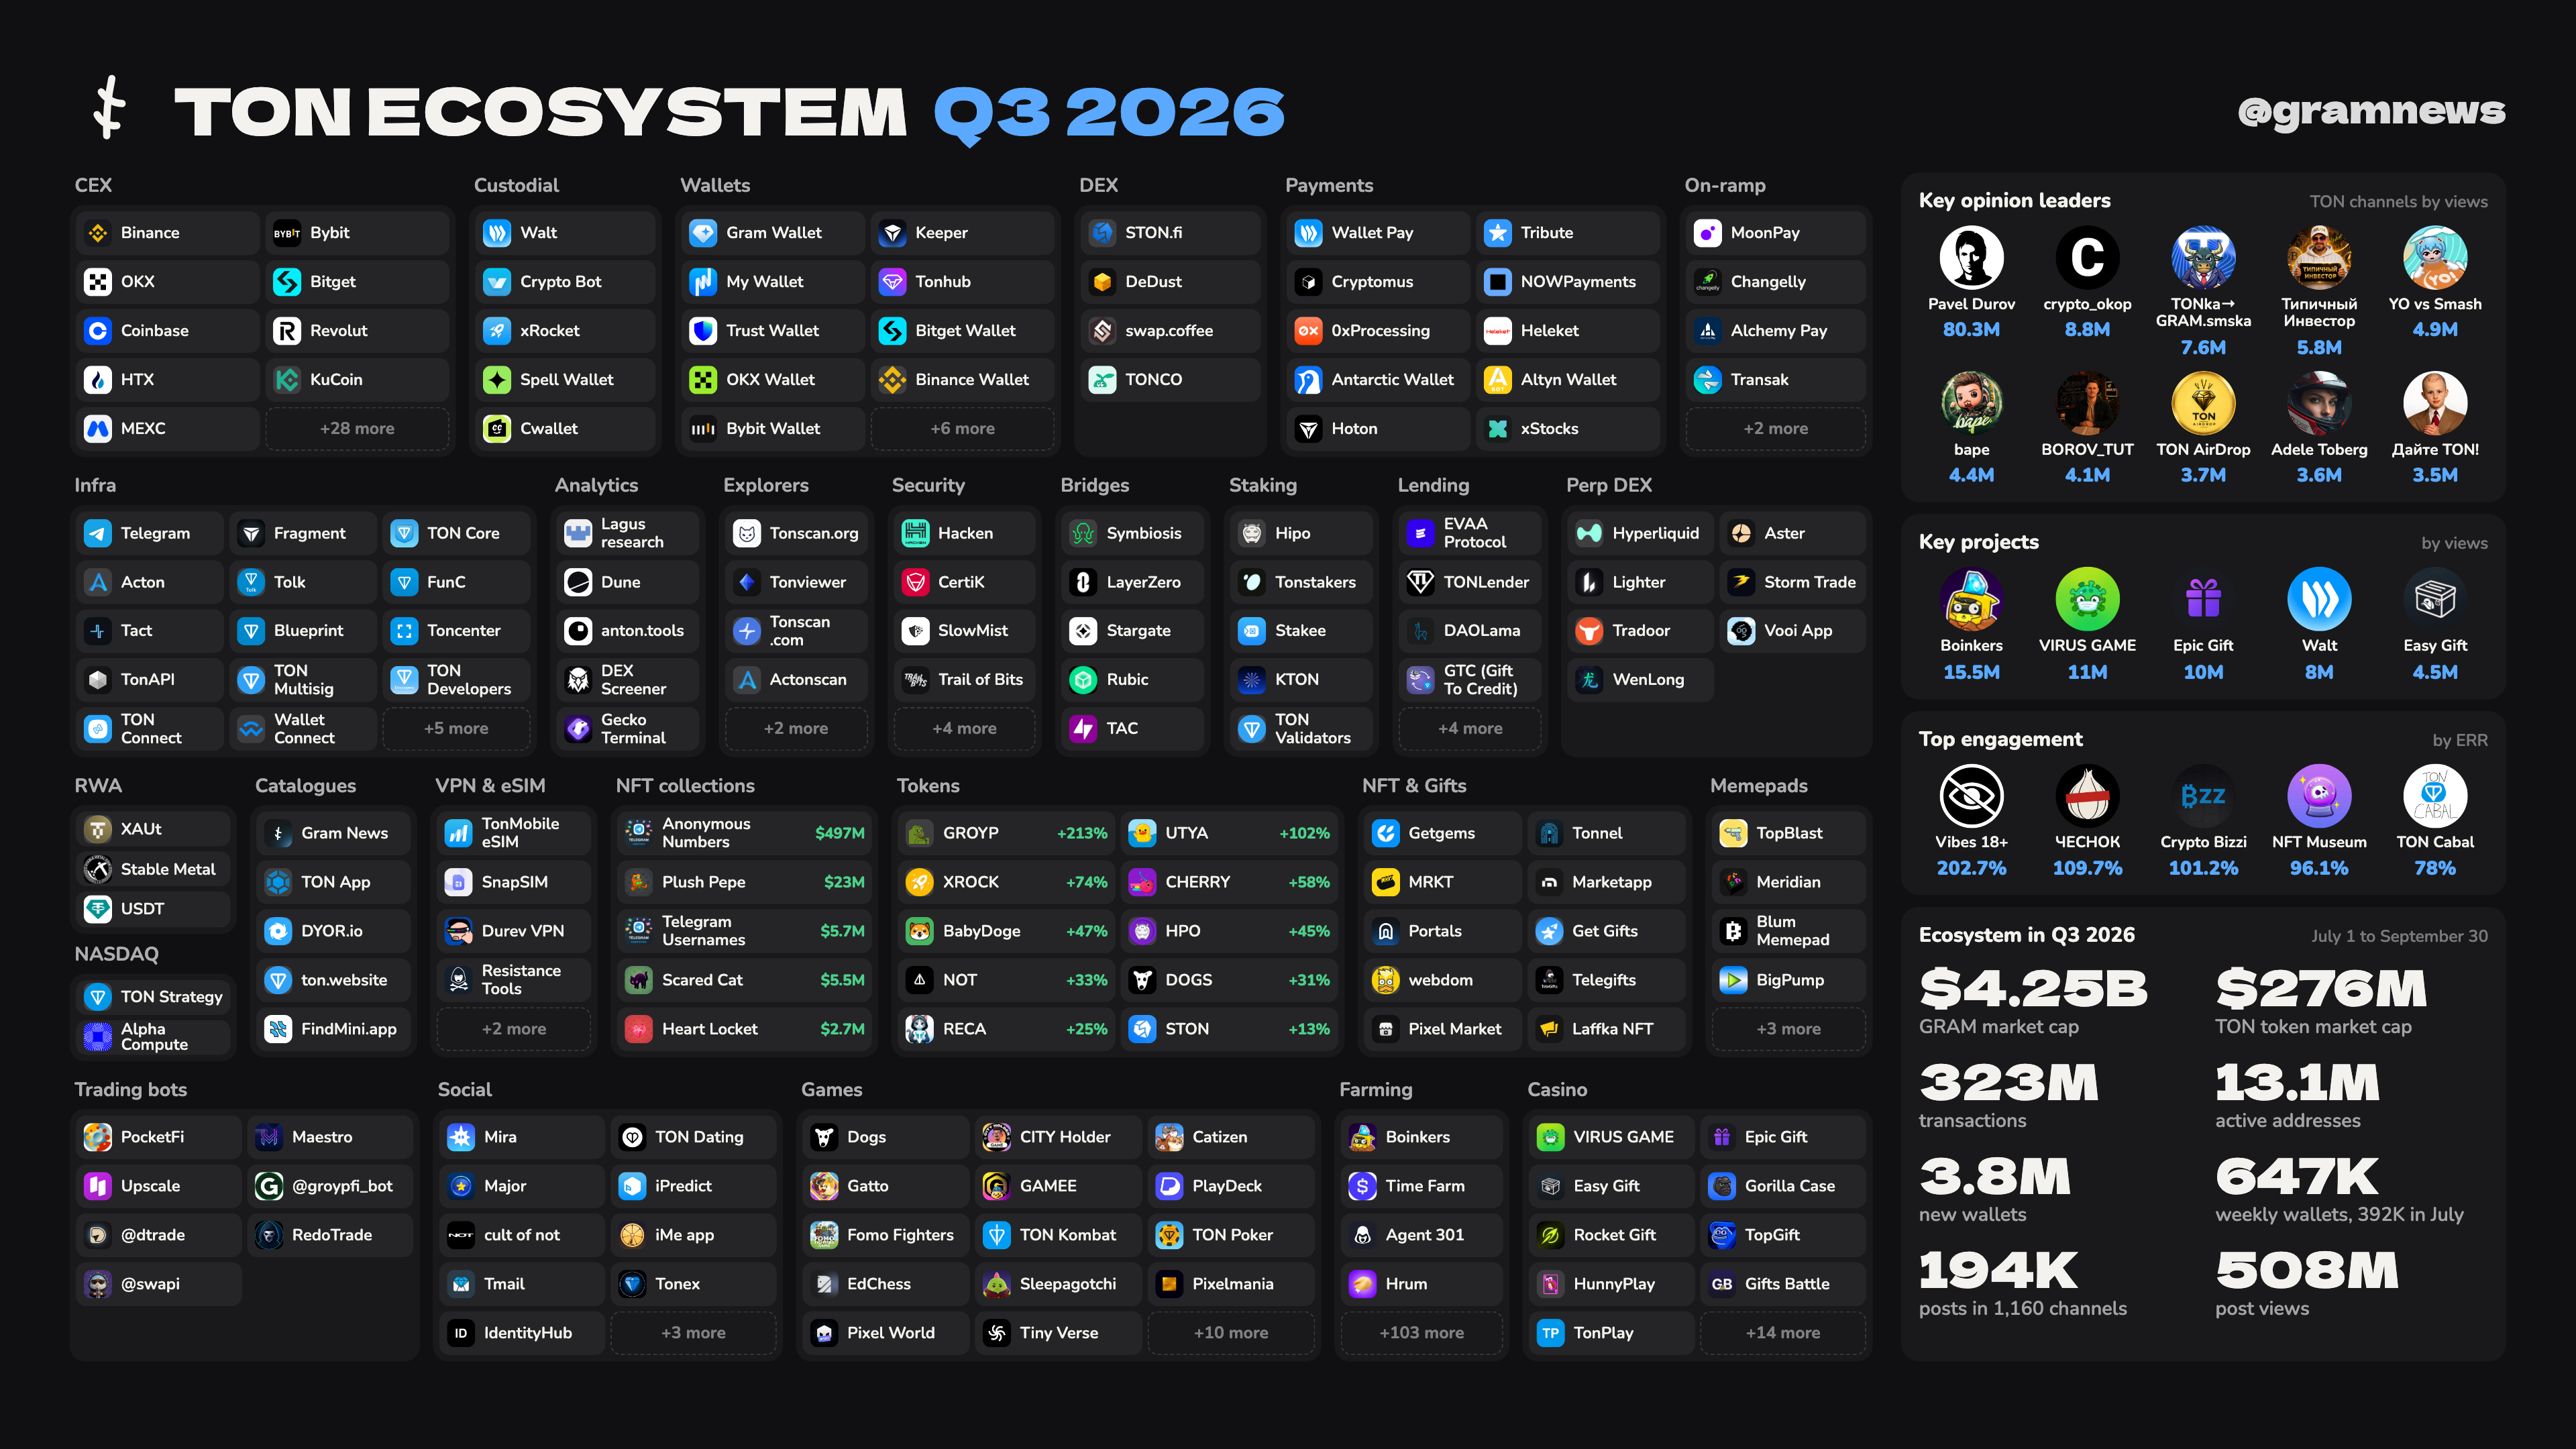
From July 1 to September 30, 2026, the TON network processed 323 million transactions, and 1,160 channels in its ecosystem published 194,000 posts. The quarter’s map brings together 356 projects that showed signs of life, sorted into 27 categories, from exchanges and wallets to farming and casinos. The interactive version with a leaderboard for every category is at the end of the article.
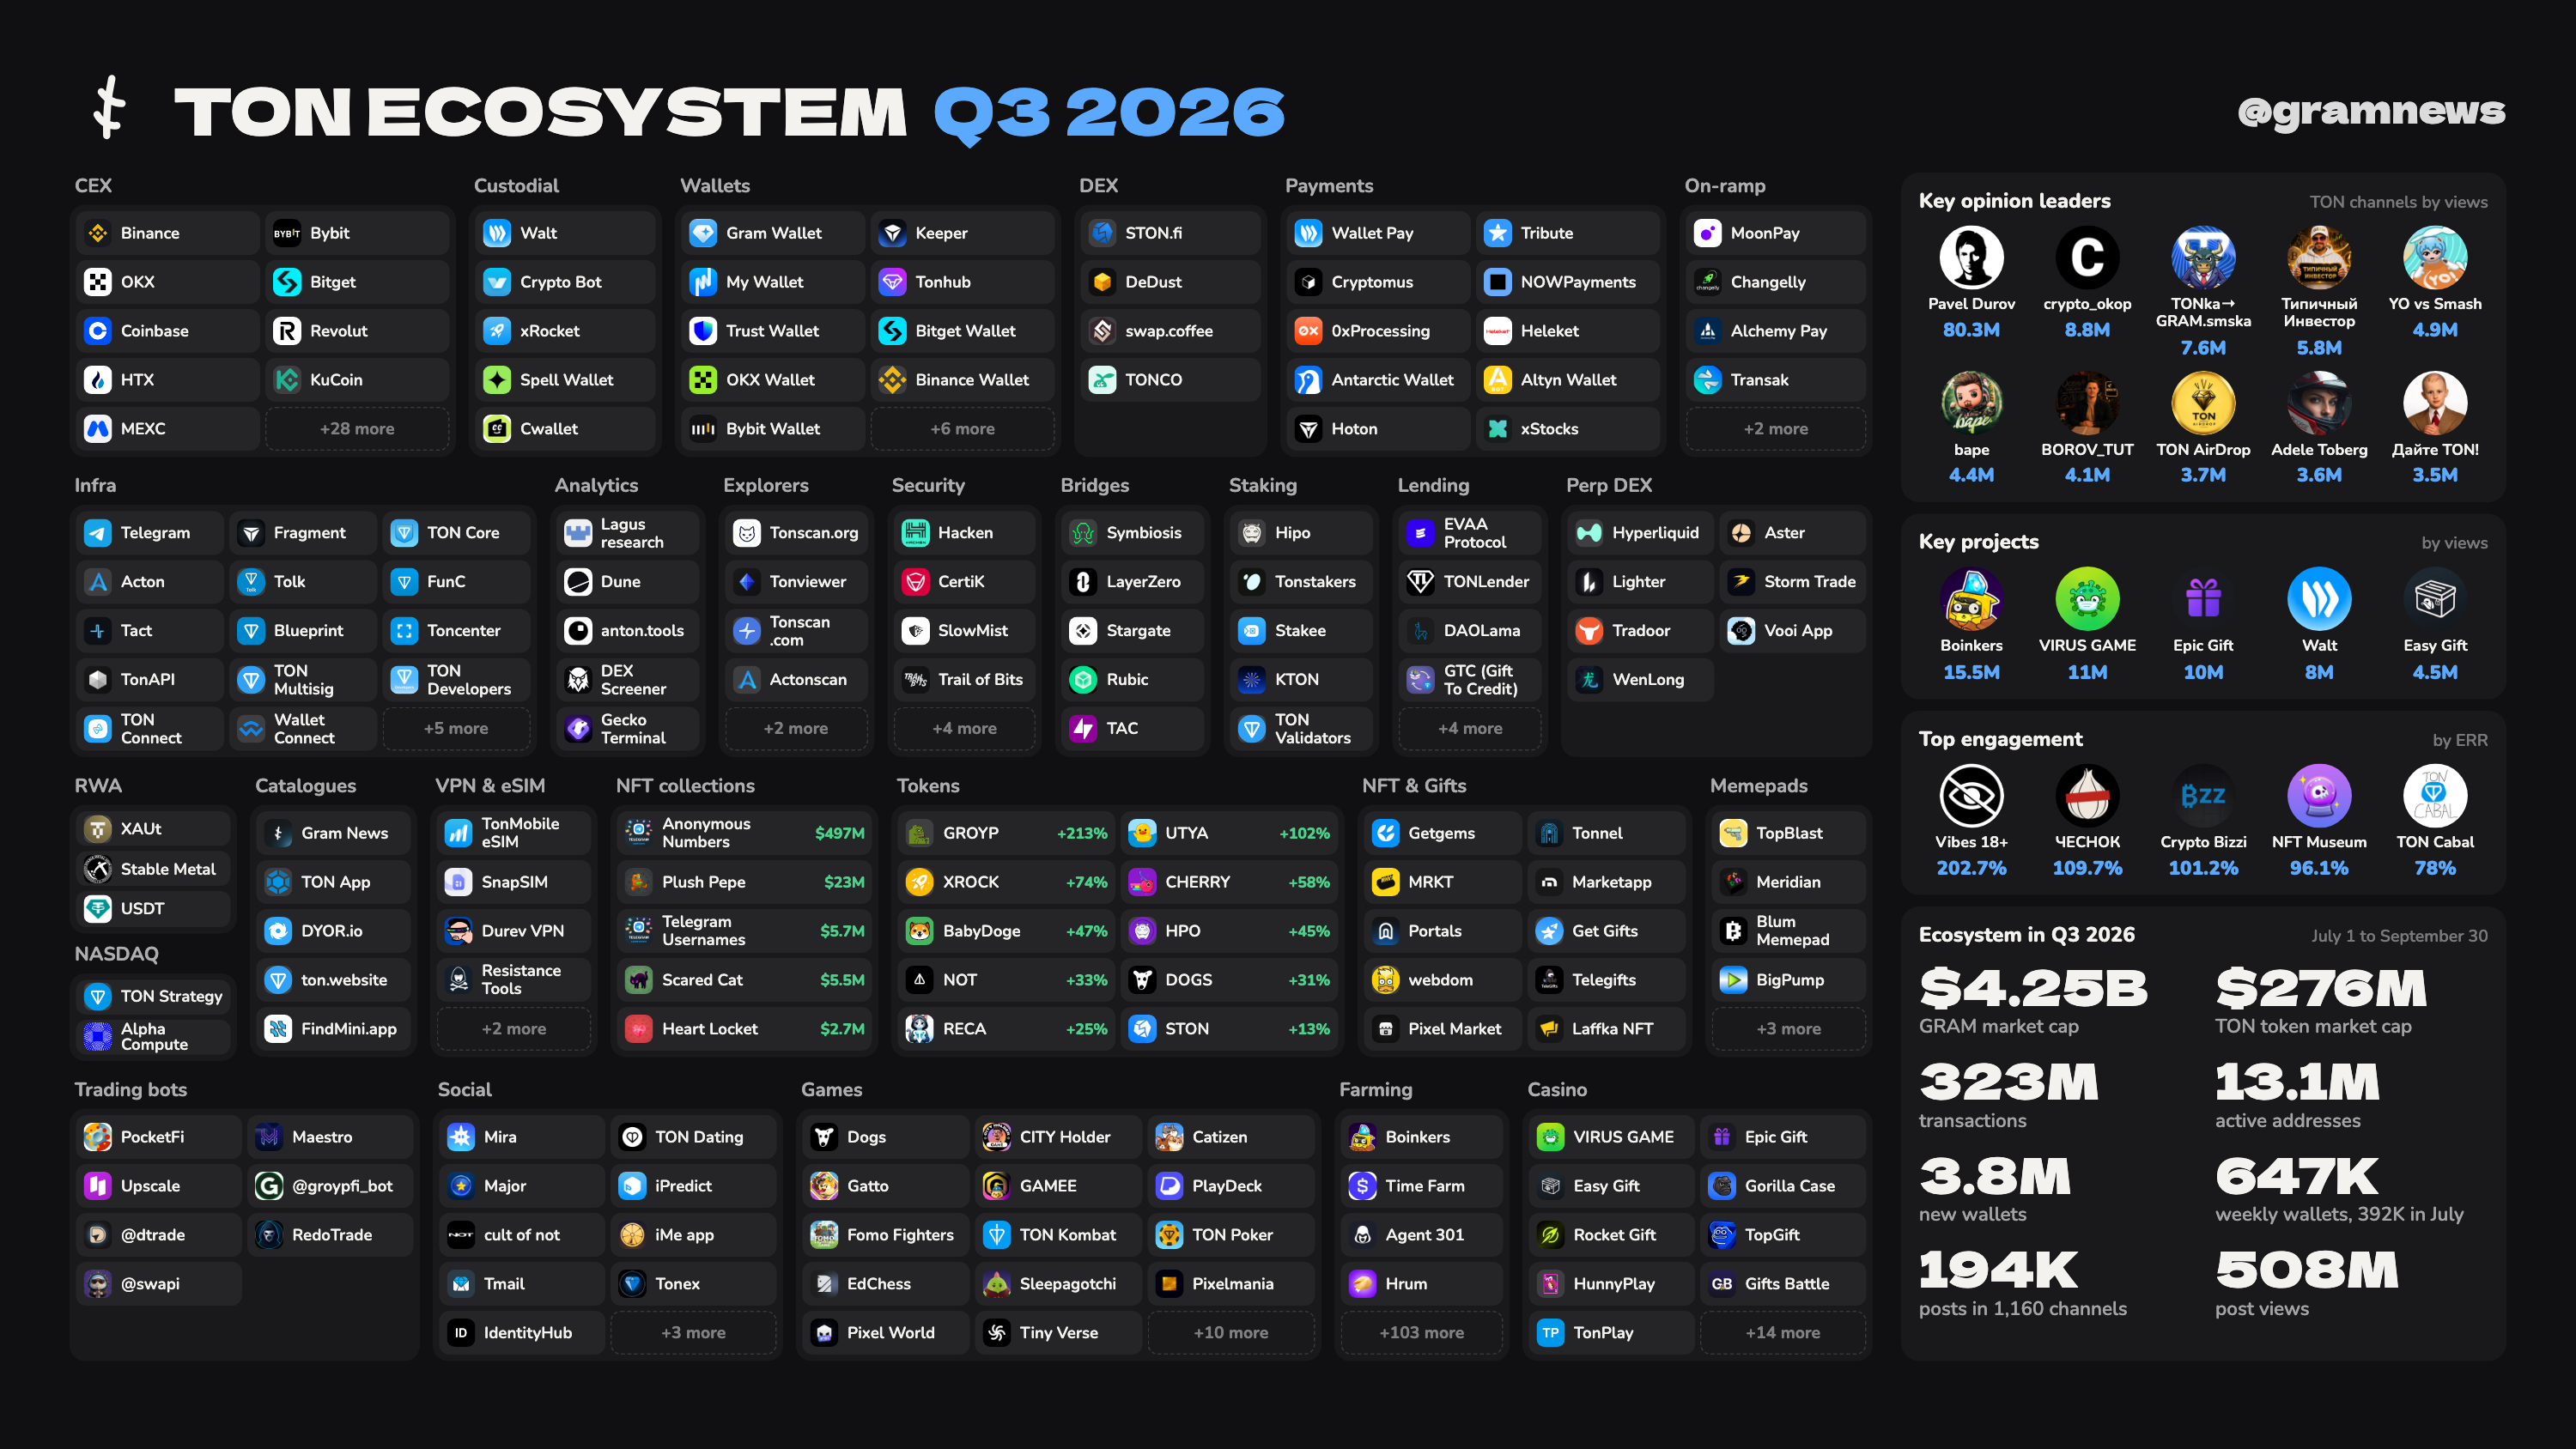
Download the poster as PNG
| Full HD, 1920×1080 | 2K, 2560×1440 | 4K, 3840×2160 | |
|---|---|---|---|
| Russian | download | download | download |
| English | download | download | download |
The quarter in numbers
| What | How much |
|---|---|
| Transactions on the network | 323M (July 97.2M, August 115.8M, September 110.1M) |
| Addresses that made at least one transaction | 13.1M |
| New wallets | 3.8M |
| Non-custodial wallets active in a week | 392K in early July, 647K in late September |
| GRAM market cap on September 30 | $4.25B |
| Market cap of liquid TON tokens other than GRAM | $276M |
| Posts in ecosystem channels | 193,755 across 1,160 channels |
| Views of those posts | 508M |
The most crowded category is farming: 107 tap-to-earn apps, clickers and bots that reward activity, against 24 games. Boinkers drew the most views of any project, 15.5M, followed by VIRUS GAME, Epic Gift, Walt and Time Farm.
Among the authors who write about TON, one stands apart: Pavel Durov’s channel collected 80.3M views over the quarter. The next by reach, crypto_okop, has 8.8M, almost ten times fewer.
Tokens are picked by price growth over the quarter: GROYP gained 213%, UTYA 102%, XROCK 74%. The most valuable NFT collection is Anonymous Telegram Numbers at $497M by its cheapest listing; the second, the Plush Pepe gift, is worth $23M.
Who is on the map
A project makes the map if at least one of five conditions held during the quarter:
- its Telegram channel published a post;
- its X account published a post;
- Gram News covered an event of the project;
- its bot had 10,000 or more monthly users in the September measurement, and the bot matches the project by name;
- the service itself works and shows data from the quarter.
A channel counts toward a project only if it matches the project by name or was linked by hand: catalogue links often point to someone else’s channel, and without this check outside views would end up among the leaders. The fourth condition brought back projects with a silent channel but a live bot: Hamster Kombat has not posted to its channel since January 20, while 833,000 people used its bot in September.
Major brands without a TON channel of their own, such as Coinbase, Revolut, Ledger, Hyperliquid and TON DNS, were added by the editors; there are 48 such entries. Each one carries a mark in the data saying which condition put it on the map.
How categories are sorted
Within a category, projects are ordered by reach, the larger of two numbers: views of the project’s posts over the quarter on Telegram and X, or its bot’s monthly users. The two numbers are of different kinds, and the choice is deliberate: otherwise My Duck, with 851,000 bot users and no posts, would sit at the bottom.
In categories where readers have obvious expectations, major brands come first: Binance and Bybit among exchanges, Getgems in NFT, Gram Wallet and Keeper among wallets, Hyperliquid in Perp DEX. After them the order is by reach again.
Two categories work differently. Tokens are ranked by price change from July 1 to September 30; to qualify, a token must be on the tonapi whitelist, not be a stablecoin, have a market cap of $1M or 5,000 holders, and have a channel that posted during the quarter. NFT collections are ranked by market cap on September 30: the price of the cheapest listed item times the number of NFTs in the collection.
Opinion leaders and engagement
Opinion leaders are TON channels that do not belong to any project, ranked by total post views over the quarter. Automated price and trade feeds are left out: they publish hundreds of posts a day and would take the whole ranking. Channels with signs of inflated views were checked separately, by how much views vary between posts and by the share of reactions, and two of them were removed.
Engagement is ERR: average views per post divided by the number of subscribers. It is counted for channels with at least a thousand subscribers and 20 posts in the quarter; otherwise the top would go to channels with three posts and a hundred subscribers.
Where the network numbers come from
Transactions and active addresses are counted from toncenter’s public ClickHouse database: the number of transactions and unique accounts for July, August and September. New wallets and weekly activity of non-custodial wallets come from a public TON Foundation query on Dune. The GRAM market cap is taken from CoinGecko on September 30.
The market cap of the other tokens is the sum over 23 liquid TON tokens from Gram News market snapshots in the last two days of the quarter: at least $10,000 of daily volume and a thousand holders. Without this filter the sum comes to $490M, but bridged tokens inflate it: BabyDoge carries its global $174M market cap in the snapshot while trading $805 a day on TON. The sum also leaves out GRAM, USDT, other stablecoins and staked GRAM; otherwise the same coin would be counted twice.
Posts and views are collected from the public t.me web feed of every ecosystem channel: 2,648 channels in the sample, of which 1,160 posted during the quarter.
What the data leaves out
Views on X are taken from profile pages and are visible to a guest only for the latest posts, so for X they are a lower bound. A bulk check of X ran into request limits, and activity on X was credited to only a handful of projects.
Interactive map
Click a category to open its leaderboard with the numbers it is sorted by. The link to the open category stays in the address bar.
Loading the map…