Since October, Telegram's macOS beta has been developing a product analytics subsystem. It tracks screen views, events in menus and settings, funnels with outcomes, and user journeys through media, forwarding, and stickers. Alongside this, it includes privacy rules and revocable consent. There is no toggle in the interface yet, and these classes are not visible in other clients. However, the released Telegram Desktop client and API documentation have described since spring 2026 how the client reports to the server how long a post was on screen and how much of a song was listened to.
What Appeared in the macOS Beta
The macOS beta is distributed via the update feed; its source code is not publicly available. The subsystem's composition is visible from the type names in the builds' executables, which appeared in three stages.
| Build | Date | What Was Added |
|---|---|---|
| 12.10.283258 | 3 October | Network telemetry NetworkTelemetry: measurements, events, disconnections, period summaries, storage; alongside it — RecordingNetworkEngine, recording network behavior |
| 13.0.283308 | 11 October | AppAnalytics, AnalyticsScreenTracker, AnalyticsEvent, AnalyticsEventSpec, AnalyticsSchema, AnalyticsMenu, AnalyticsSetting — screen views and events according to a predefined schema |
| 13.0.283338 | 19 October | User journeys AnalyticsMediaJourney, AnalyticsShareJourney, AnalyticsStickerJourney, AnalyticsMessageSend; funnels AnalyticsFlow and AnalyticsFlowOutcome; AnalyticsPrivacy, AnalyticsRevocable, AnalyticsScope, AnalyticsParameterRule; collector AppLogEventCollection |
In product analytics, a funnel is a chain of steps towards a goal, noting at which step a person dropped off: for example, opened the sticker panel, selected a sticker, sent it, or closed the panel. A journey is the same chain for a single scenario. By name, three scenarios are visible: media, forwarding, and stickers. Separately, it tracks the origin of transitions to the built-in browser (BrowserAnalyticsOrigin) and the section where the gallery is opened (GalleryAnalyticsContext).
This block behaved like an experiment. Less than two hours after build 283338, the next build, 283342, was released without it. On 23 October, it returned in 13.1.0.283362 and has remained since — all classes are present in builds from 26 October and later.
Is There a Toggle?
In the interface — no. Neither in the binary strings, nor in the resource package, nor in the macOS client's translations is there any text about analytics, usage statistics, or consent to data collection.
There is a hint in the code. AnalyticsPrivacy and AnalyticsRevocable by name suggest privacy rules and revocability, AnalyticsParameterRule suggests a rule for which event parameters are allowed to be transmitted, and AnalyticsScope suggests the scope of action. This is a hypothesis based on names, without the code: this is typically how analytics is structured when a user can opt out of data collection, and events do not carry unnecessary fields.
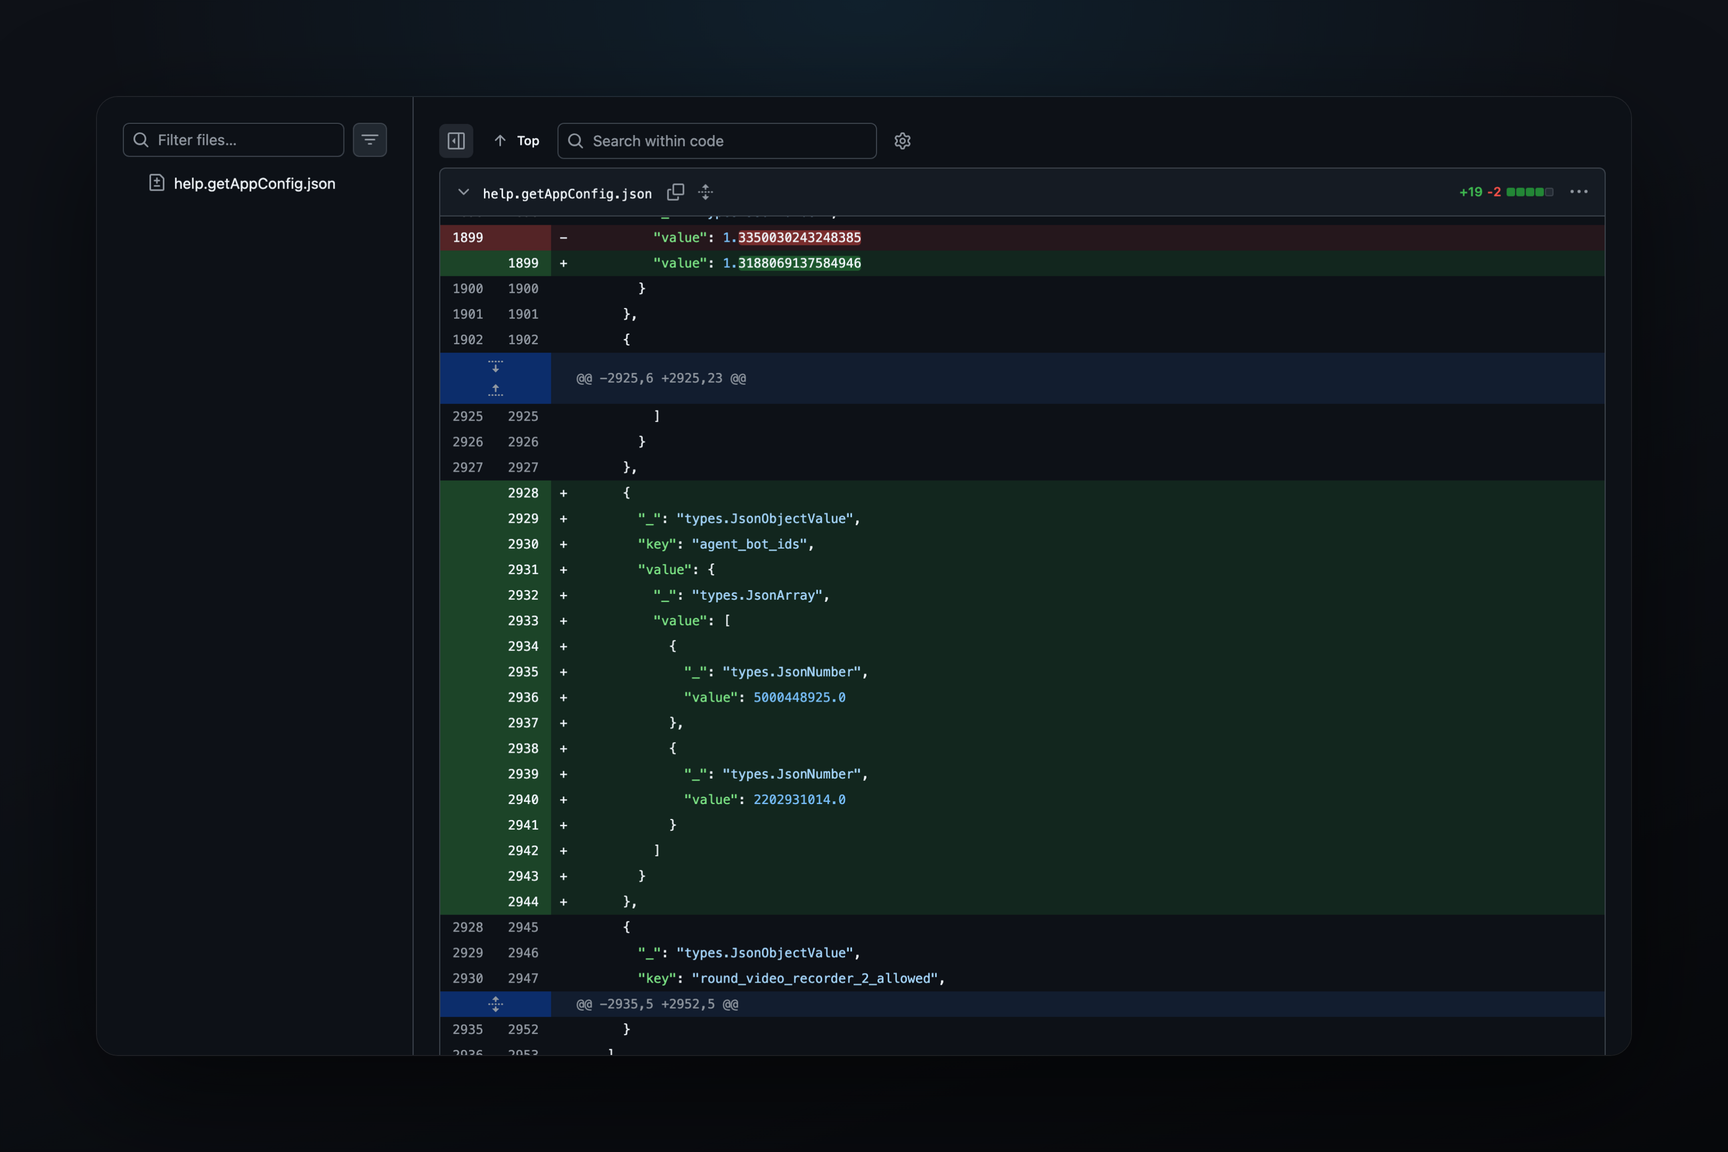
The names do not indicate where the events are sent. The public API schema has long included the help.saveAppLog method: it accepts a batch of events with time, type, peer, and arbitrary JSON. The collector in the beta is called AppLogEvent*, but the connection between them is a guess based on the similar naming.
What Released Clients Already Track
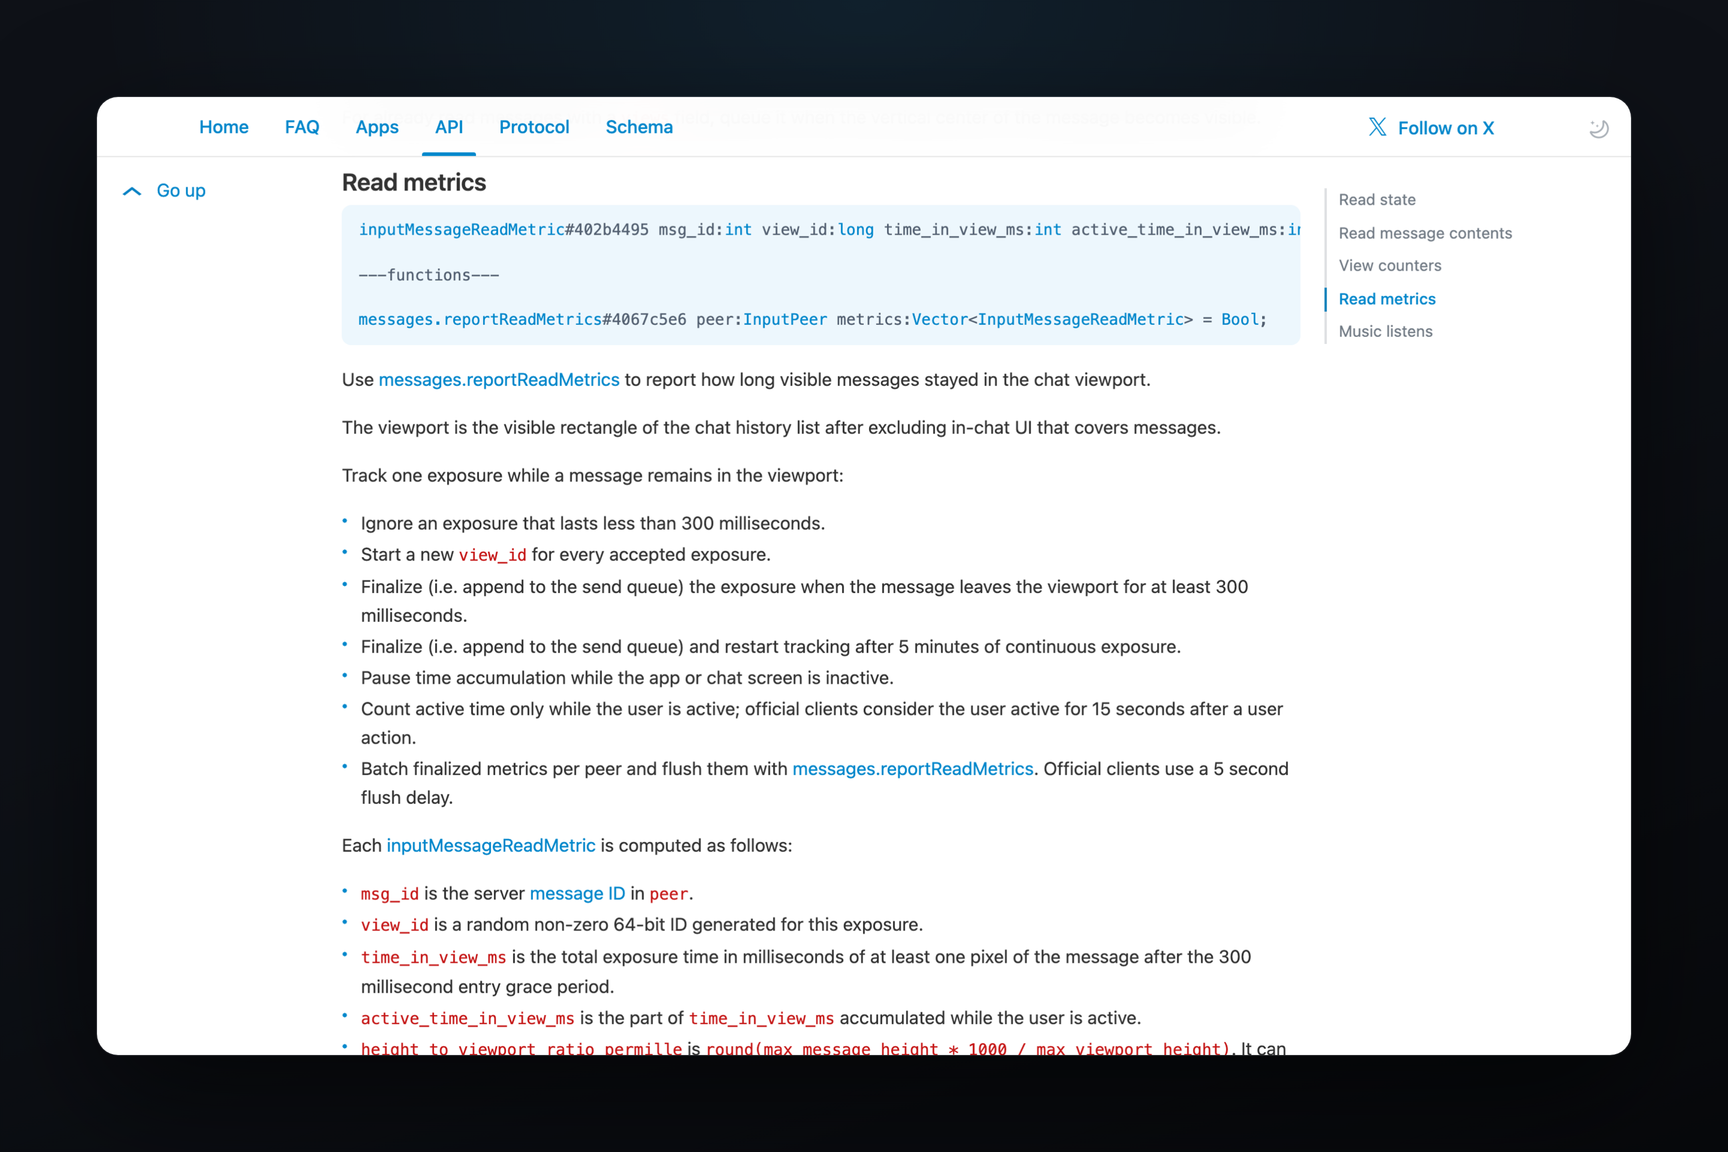
Some measurements have long been beyond the experimental stage. The API documentation describes the messages.reportReadMetrics method: the client reports to the server how long each message remained in the chat viewport. The rules are detailed down to the millisecond.
- A view shorter than 300 ms is not counted.
time_in_view_ms— how long the message was visible by at least one pixel.active_time_in_view_ms— the portion of that time when the user was active; official clients consider a user active for 15 seconds after any action.seen_range_ratio_permille— what proportion of the post's height was in the visible area, in thousandths.- Continuous views longer than five minutes are split into separate views; measurements are accumulated per chat and sent in a batch with a 5-second delay.
The same documentation describes messages.reportMusicListen — how many seconds of a song were listened to. Telegram Desktop has been sending both measurements since March 2026: post view tracking and listening tracking appeared in the code on the same day, 25 March.
These measurements answer the question "what is being read and listened to," while the new subsystem addresses "how the application itself is being used." The first concerns channels and content, the second concerns screens, buttons, and scenarios.
Network Telemetry and the Rust Engine
The earliest part, NetworkTelemetry, arrived on 3 October alongside RecordingNetworkEngine and relates to a different task. A day earlier, on 2 October, the Rust network engine — RustNetworkEngine, RustRequestService, RustEngineNetworkRouter — and a common NetworkEngine interface with a SwitchingNetworkEngine toggle appeared in the beta. The strings «Rust (restart required)» and «Engine switch to rust refused» indicate that the engine changes with a restart, while «Rust engine crash of» and «Rust panic» indicate that its crashes are caught separately.
The telemetry stores latencies, disconnections, and error classes, while the recording engine logs requests and responses from either of the two stacks. Together, this looks like a test bench for comparing the old network code with the new one using live traffic. There is no method in the schema that would send network telemetry to the server — reports might remain local.
Where This Is Not Present
Telegram's Android beta 13.2.0 from 27 October contains neither Analytics* nor NetworkTelemetry. Everything there named analytics and telemetry belongs to built-in Google libraries: Cast, Play Services, and Firebase Crashlytics. The reportReadMetrics method is described in the Android code, but no call is visible in the beta.
Product analytics is also absent from Telegram Desktop — it only includes the post view and song listening tracking described above.